Feeling that the computer is slow, freezing, noisy, or taking too long to respond is a very common experience, especially after some time of use, and this situation often creates anxiety because many users do not know where to look or what information actually matters.
In most cases, a slow computer does not mean that it is broken, old, or beyond repair, because performance problems are frequently caused by temporary overload, too many programs running at the same time, or system resources being pushed beyond what is comfortable.
This complete guide on how to check computer performance was created for users who feel their computer is sluggish but want to understand the situation calmly, without panic, technical jargon, or exaggerated conclusions.
Throughout this article, you will learn what computer performance really means, how to use Task Manager on Windows and Activity Monitor on Mac, what CPU usage and memory usage actually represent, how to identify signs of overload, and which simple and safe steps can help relieve pressure on the system.
The objective is to give you clarity, confidence, and basic diagnostic skills, so you can better understand your computer’s behavior before deciding what to do next.
What Computer Performance Really Means in Simple Terms
Computer performance refers to how smoothly and quickly your computer can handle tasks, respond to commands, open programs, and switch between activities without delays or freezing.
Performance is not a single number or indicator, but a combination of how the processor, memory, storage, and running programs interact at any given moment.
Main Components That Affect Performance
- Processor usage.
- Memory usage.
- Disk activity.
- Number of running programs.
When one of these areas is overloaded, the computer can feel slow.
Why Computers Become Slow Over Time
Many users believe that computers slow down simply because they are getting old, but in reality, slowness is often related to usage habits, background programs, and accumulated tasks rather than age alone.
Common Reasons for Slowness
- Too many apps running at once.
- Programs starting automatically.
- Heavy browser usage.
- Limited available memory.
Understanding these reasons helps reduce worry.
When It Makes Sense to Check Computer Performance
Checking performance is useful when the computer shows signs that it is struggling to keep up with normal tasks.
Common Warning Signs
- Programs open very slowly.
- Mouse cursor freezes.
- Fans become loud.
- System feels unresponsive.
These signs suggest temporary overload.
What You Do Not Need to Check Right Away
Many users rush to install optimization tools or worry about viruses immediately, but for basic performance checks, built-in system tools are usually enough.
Things You Can Ignore at First
- Advanced benchmarks.
- Complex technical graphs.
- Third-party cleaners.
Simple observation comes first.
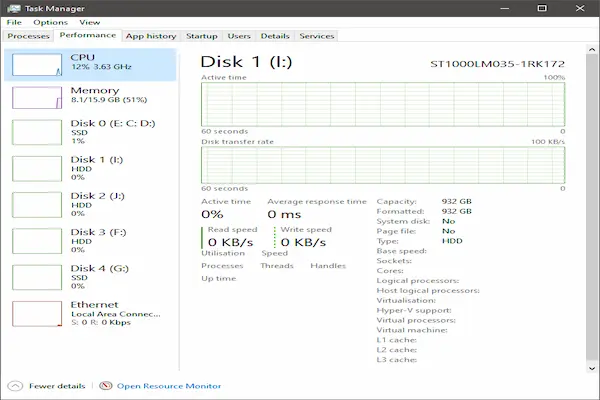
Introducing Task Manager on Windows
Task Manager is a built-in Windows tool that shows what is running on your computer and how much of the system resources are being used in real time.
This tool is one of the most useful ways to understand whether your PC is overloaded.
What Task Manager Shows
- Running applications.
- CPU usage.
- Memory usage.
- Disk activity.
You do not need to understand everything to benefit from it.
How to Open Task Manager on Windows
Opening Task Manager is quick and safe.
Common Ways to Open Task Manager
- Right click the taskbar and choose Task Manager.
- Press Ctrl, Shift, and Esc together.
The window opens immediately.
Understanding the Task Manager Layout
Task Manager may open in a simple view or a detailed view, depending on your system.
Main Tabs in Task Manager
- Processes.
- Performance.
- Startup.
The Processes and Performance tabs are the most important for beginners.
Checking CPU Usage in Task Manager
CPU usage shows how hard the processor is working at a given moment.
How to Read CPU Usage
- Low usage means light workload.
- High usage means heavy workload.
Spikes are normal, constant high usage is not.
What Is Considered High CPU Usage
- Short spikes above 70 percent can be normal.
- Constant usage near 100 percent indicates overload.
Context matters when interpreting numbers.
Identifying Programs Using Too Much CPU
Task Manager allows you to see which programs are using the most CPU.
How to Sort by CPU Usage
- Go to the Processes tab.
- Click on the CPU column.
The list reorganizes automatically.
What to Look For
- Programs using high CPU constantly.
- Unexpected background apps.
This helps identify resource-heavy tasks.
Understanding Memory Usage in Task Manager
Memory, often called RAM, is used to keep programs active and responsive.
How Memory Usage Affects Performance
- Low memory slows switching between apps.
- High memory usage can cause freezing.
Memory pressure is a common issue.
Reading Memory Usage
- Moderate usage is normal.
- Very high usage indicates strain.
Running out of free memory causes slowdowns.
Checking Disk Activity on Windows
Disk activity shows how much the computer is reading or writing data.
When Disk Usage Becomes a Problem
- Disk usage stays near 100 percent.
- System feels slow even with low CPU.
This can cause noticeable lag.
Introducing Activity Monitor on Mac
Activity Monitor is the macOS equivalent of Task Manager, offering a clear view of what is happening inside your Mac.
This tool is designed to be visual and informative.
What Activity Monitor Displays
- CPU usage.
- Memory usage.
- Energy impact.
- Disk activity.
You do not need advanced knowledge to use it.
How to Open Activity Monitor on Mac
Opening Activity Monitor is simple.
Common Ways to Open Activity Monitor
- Use Spotlight search.
- Open it from the Utilities folder.
The window shows activity instantly.
Understanding the Activity Monitor Layout
Activity Monitor organizes information into tabs at the top.
Main Tabs to Focus On
- CPU.
- Memory.
These tabs are enough for basic checks.
Checking CPU Usage on Mac
The CPU tab shows how much processing power is being used.
How to Interpret CPU Information
- Multiple processes share CPU.
- High usage may slow the system.
Short bursts are expected.
Sorting Processes by CPU Usage
- Click the CPU column.
This highlights demanding apps.
Understanding Memory Usage on Mac
Memory pressure is shown visually in Activity Monitor.
Memory Pressure Indicator
- Green means healthy.
- Yellow means caution.
- Red means overload.
This visual makes interpretation easier.
What “Free Memory” Really Means
Free memory does not mean unused, but rather memory available for new tasks.
Why Free Memory Matters
- Low free memory slows performance.
- System may rely on disk.
Disk-based memory is much slower.
Signs That Too Many Programs Are Open
Running many programs at once is one of the most common causes of poor performance.
Common Symptoms
- Slow switching between apps.
- Delayed typing response.
- System fan noise.
Closing unused apps often helps.
How Browsers Affect Performance
Web browsers are powerful tools, but they can consume significant resources.
Why Browsers Use So Much Memory
- Many open tabs.
- Heavy websites.
- Background extensions.
Managing tabs improves performance.
Simple Steps to Relieve Performance Pressure
Once you identify overload, small actions can make a noticeable difference.
Immediate Relief Steps
- Close unused programs.
- Reduce browser tabs.
- Restart heavy apps.
These steps are safe and effective.
Restarting the Computer as a Reset
Restarting clears temporary processes and memory usage.
When Restarting Helps
- After long uptime.
- After heavy tasks.
Restarting is not a failure.
Checking Startup Programs
Programs that start automatically can slow performance from the beginning.
Why Startup Programs Matter
- They use memory immediately.
- They increase boot time.
Reducing them improves responsiveness.
Temporary Versus Constant Performance Issues
Not all slowdowns indicate a serious problem.
Temporary Issues
- During updates.
- During heavy tasks.
Constant Issues
- Slow even when idle.
- High usage without reason.
Patterns matter more than moments.
When Not to Panic About High Usage
Seeing high numbers briefly can be alarming, but it is often normal.
Normal High Usage Scenarios
- Opening large files.
- Installing updates.
Time context is important.
When It Makes Sense to Investigate Further
Persistent high usage may require deeper investigation.
Warning Patterns
- High CPU at idle.
- Memory pressure always red.
These patterns deserve attention.
Common Myths About Computer Performance
Myth: High CPU Always Means Damage
CPU usage reflects workload, not damage.
Myth: Free Memory Should Always Be High
Memory is meant to be used.
Myth: Slowness Always Means Replacement
Many issues are temporary.
Building a Healthy Performance Habit
Occasionally checking performance builds awareness.
Simple Monitoring Routine
- Check when system feels slow.
- Observe patterns, not numbers.
This prevents unnecessary worry.
Practice Exercise: Your First Performance Check
Exercise 1: Open System Monitor
- Open Task Manager or Activity Monitor.
Exercise 2: Observe CPU and Memory
- Notice usage at rest.
- Open an app and observe change.
Exercise 3: Close One Program
- Close an unused app.
- Observe improvement.
Observation builds understanding.
Frequently Asked Questions About How to Check Computer Performance
Is high CPU usage always bad?
No, it depends on what the computer is doing.
Should I close everything with high usage?
Only close what you do not need.
Do I need special software?
No, built-in tools are enough.
Final Thoughts and a Calm Next Step
Learning how to check computer performance empowers you to understand what is happening behind the scenes without fear, exaggerated conclusions, or unnecessary technical stress.
When you know how to use Task Manager or Activity Monitor, interpret CPU and memory usage calmly, and recognize the difference between normal workload and real overload, you gain control over your computing experience.
Could you take a moment the next time your computer feels slow to open the system monitor, observe resource usage for a minute, and apply one simple relief step, just to experience how understanding performance changes the way you react to slowness?